Hydroinformatics Blog - Advances in biogeochemical modeling and management of San Francisco Bay ecosystem
Posted Dec 7, 2023
Hydroinformatics Blog Post
Organized by the CUAHSI Informatics Standing Committee. Contributions are welcome, please contact Veronica Sosa Gonzalez at email hidden; JavaScript is required.
By: Farid Karimpour
San Francisco Bay (SFB) is a nutrient-enriched estuary that receives the majority of its nitrogen and phosphorus loads from wastewater treatment plants (WWTP) distributed throughout the system, which treat wastewater from the SFB area’s 7.5 million people (SFEI 2014a; SFEI 2014b; Cloern et al. 2020). Despite its high nutrient levels that rank SFB among the most nutrient-enriched estuaries worldwide, SFB rarely experiences severe impacts that are common in other historically nutrient enriched estuaries such as the Chesapeake Bay. However, the system is at risk of experiencing adverse effects of nutrient enrichment as evidenced by harmful algal blooms like the one occurred in August 2022.
One major emphasis in the study of SFB involves developing numerical models to simulate hydrodynamics and biogeochemical processes in SFB and undertaking studies using those models to answer applied science questions related to nutrient transport and cycling and the effects of nutrients on water quality. To that end, a coupled three-dimensional hydrodynamic-biogeochemical model of SFB has been developed and validated for water years 2013 to 2018 (WY2013-WY2018). The SFB hydrodynamic model is built on D-Flow Flexible Mesh (DFM). DFM is part of the Deltares suite of models, which also includes D-Water Quality (DWAQ), the platform that models the biogeochemical processes.
DFM is a finite-volume, three-dimensional, unstructured hydrodynamic model (Martyr-Koller et al. 2017). In our model, the horizontal grid resolution varies from 20 m in select sloughs of Lower South Bay, to over 2 km at Point Reyes. Nominal grid resolution in South Bay is 250 m, and 350-500 m in North Bay, for a total of 49,996 cells in the horizontal. The three-dimensional model uses a sigma coordinate in the vertical, such that all areas have 10 layers in the vertical, with uniform layer thicknesses varying in accordance with the overall depth. The DFM unstructured hydrodynamic model provides water surface elevations and velocities that are used as input to DWAQ for simulating transport.
This process-based, numerical model will be used to inform nutrient management decisions by:
-Improving quantitative understanding of processes that shape current conditions,
-Forecasting ecosystem response under future scenarios, and
-Evaluating potential effectiveness of management actions.
Results and Conclusion
This hydrodynamic model is validated using different data sets such as NOAA tide gauges record 6-minute water level data at numerous sites around the perimeter of SFB. Validation of water levels at tidal time scales is an essential baseline metric for a coastal hydrodynamic model. The most relevant metrics for tidal validation in open areas of SFB are the amplitude and lag. Tides are amplified and attenuated due to geometry and frictional characteristics of SFB, a process that is captured by the comparison of amplitudes. The timing or phase of water level is driven by the same characteristics, with friction generally slowing the propagation of the tidal wave, and convergent or enclosed basin geometries causing an apparent acceleration of the tidal wave (a “standing wave”).
For biogeochemical model validation, the comparisons between modeled and observed discrete and high frequency biogeochemical data were developed. Here, we only show results from WY2018. Discrete data for sites in SFB’s deep channel (Schraga et al. 2020) were used for model validation as shown in figure 1. In this figure chlorophyll-a, the dissolved inorganic nitrogen (DIN), and the dissolved oxygen (DO) are shown. The shaded area shows the diurnal range, and the solid line shows the daily average.
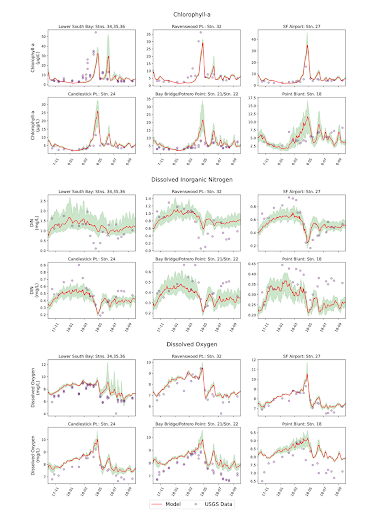
Figure 1. Predicted and observed chlorophyll-a concentrations, dissolved inorganic nitrogen (DIN) concentrations and dissolved oxygen concentrations at select USGS stations along the channel for WY2018 simulation. The shaded area shows the diurnal range.
Also, model predictions of chlorophyll-a and DO are compared to high frequency measurements at Dumbarton Bridge (DMB) and San Mateo Bridge (SMB) in figure 2. The observed discrete data from USGS cruise are also included. The high-frequency measurements at both locations are generally comparable to USGS cruise data, except for occasional deviations in chlorophyll-a. For example, at San Mateo Bridge in spring of WY2018 the high-frequency measurements appear to exhibit substantially lower chlorophyll-a concentrations relative to the cruise data even though the high-frequency DO data shows super-saturated conditions.
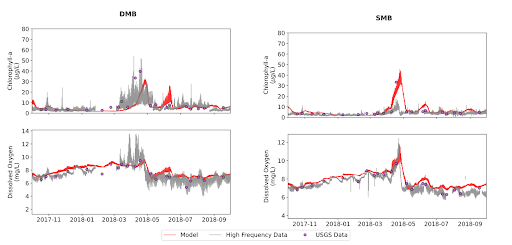
Figure 2. Comparison of full resolution model outputs with high-frequency data at Dumbarton Bridge (DMB) and San Mateo Bridge (SMB) for WY2018.
Utilizing this wide-ranging dataset, the model's performance was evaluated at different spatial scales, from sub-regional to regional, and across various time scales, including tidal, seasonal, and annual scales. The results demonstrate that the model reasonably captures the temporal and spatial variability in the observed data and is a useful tool for evaluating decisions on nutrient management for SFB.
Acknowledgments: The work presented here was supported primarily with funding from the San Francisco Bay Nutrient Management Strategy (NMS). Valuable guidance and input from numerous SFEI staff, external collaborators, and NMS stakeholders is highly appreciated.
About the author: Farid Karimpour is an environmental scientist in the Clean Water program at SFEI, where he works on numerical modeling to understand hydrodynamics and biogeochemical processes in San Francisco Bay and Delta. His expertise spans ocean, climate, and water science and high-resolution modeling and statistical analysis of physical and biogeochemical processes, their impacts on the planet and the management implications.
Author’s website: https://www.sfei.org/users/far...
References
Cloern, J.E., Schraga, T.S., Nejad, E., and Martin, C. 2020. “Nutrient Status of San Francisco Bay and Its Management Implications.” Estuaries and Coasts 43:1299-1317. https://doi.org/10.1007/s12237-020-00737-w.
SFEI (San Francisco Estuary Institute). 2014a. External Nutrient Loads to San Francisco Bay. San Francisco Estuary Institute, Richmond, California. Contribution No. 704.
SFEI. 2014b. Scientific Foundation for the SanFrancisco Bay Nutrient Management Strategy. San Francisco Estuary Institute,Richmond, California. Contribution No. 979.
Martyr-Koller, R.C., Kernkamp, H.W.J., van Dam, A., van der Wegen, M., Lucas, L.V., Knowles, N., Jaffe, B., and Fregoso, T.A. 2017. Application of an unstructured 3D finite volume numerical model to flows and salinity dynamics in the San Francisco Bay-Delta, 2017. Estuarine, Coastal and Shelf Science, Vol. 192, pp 86–107, https://doi.org/10.1016/j.ecss.2017.04.024.
Schraga, T.S., Nejad, E.S., Martin, C.A., and Cloern, J.E. 2020. USGS measurements of water quality in San Francisco Bay (CA), beginning in 2016 (ver. 3.0, March 2020): U.S. Geological Survey data release, https://doi.org/10.5066/F7D21WGF.