
Hydroinformatics Blog - Classifying NHDPlus catchments based on drought propagation mechanism
Posted Jun 6, 2023
Hydroinformatics Blog Post
Organized by the CUAHSI Informatics Standing Committee. Contributions are welcome, please contact Veronica Sosa Gonzalez at email hidden; JavaScript is required.
By: Taher Chegini
There are different types of droughts and in this blog post we focus on two: meteorological and hydrologic. Meteorological droughts refer to periods of insufficient precipitation that serve as the initial stage for hydrological droughts. The hydrological droughts involve unusually low water levels in lakes, streams, groundwater, and water supply reservoirs. The transition from meteorological to hydrological droughts is commonly known as drought propagation (Eltahir & Yeh, 1999). Van Loon and van Lanen (2012) demonstrated that drought propagation is influenced by various factors such as catchment characteristics and climate. Our main objective is to use the existing hydroclimate data at gauged locations and employ a deep learning model to classify all NHDPlus catchments over Conterminous US (CONUS). Here, we follow the approach proposed by Apurv et al. (2017) to classify catchments into three types as shown in Fig. 1.
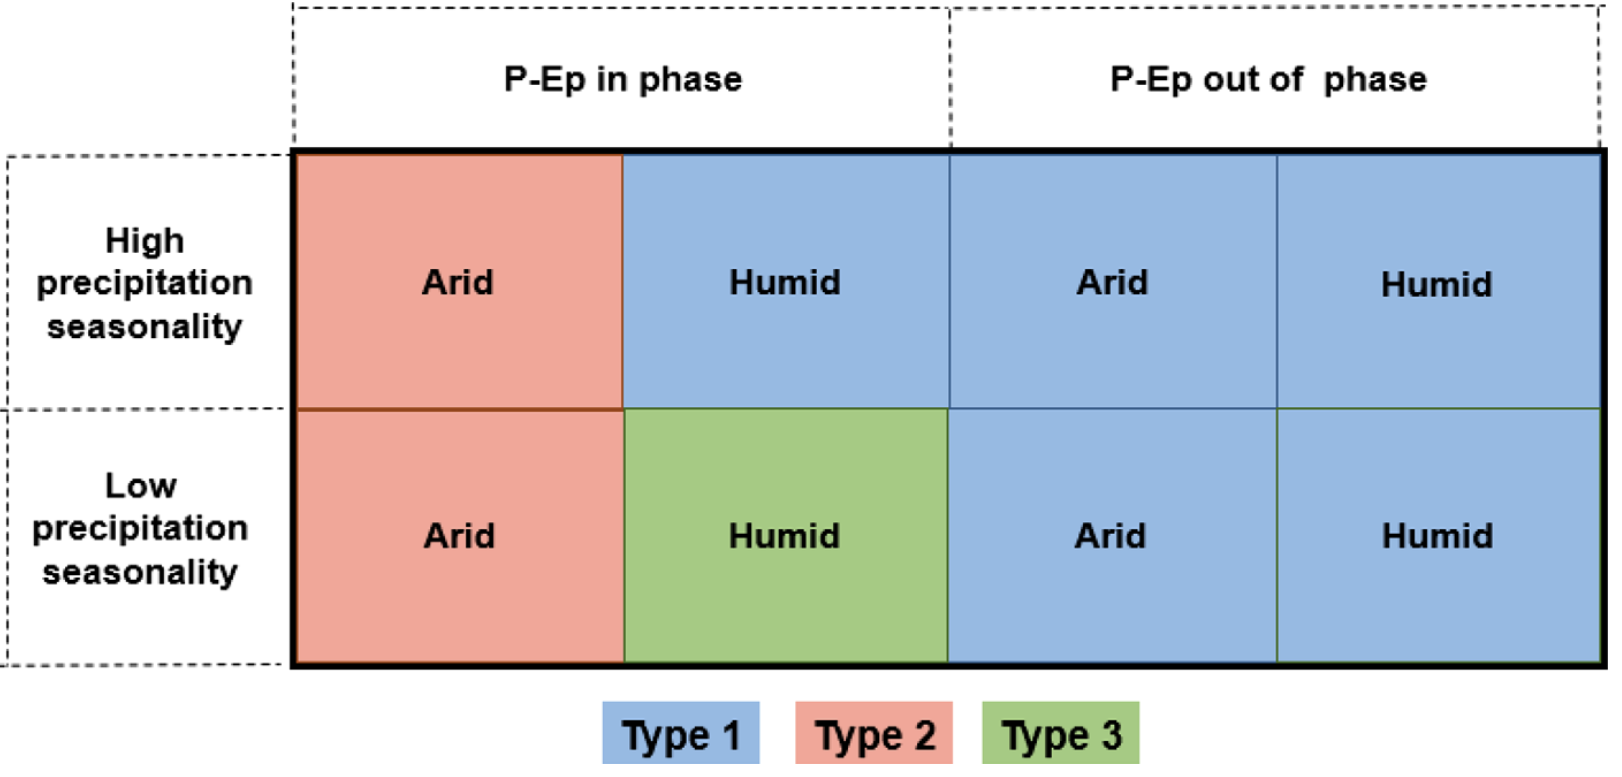
Figure 1. Three type of catchments as proposed by Apurv et al. (2017) where P is precipitation and Ep is potential evapotranspiration.
Apurv et al. (2017) employed a physical model for catchment classification, however, we use a deep learning algorithm. Moreover, we carry out our analysis for the 531 USGS stations selected by Newman et al. (2017) and use StreamCat (Hill et al., 2016) that includes over 600 catchment-level attributes.
As we can see in Fig. 1, the catchment classification is based on three hydroclimate metrics: aridity, phase, and seasonality index. We can compute all these metrics using precipitation and evapotranspiration time series. We perform all data retrieval and processing operations using HyRiver (Chegini et al., 2021) which is a suite of nine open-source Python packages that provide access to various hydroclimate datasets via web services. First, we retrieve our target USGS station identifiers using PyGeoHydro, their upstream drainage geometries using PyNHD, and precipitation and potential evapotranspiration data within the 2000-2010 period using PyNLDAS2. Then, we compute the aridity index using Budyko (1974), the phase index using a simple Spearman correlation coefficient between mean monthly summaries of precipitation and potential evapotranspiration, and seasonality index using Walsh and Lawler (1981) method.
If mean monthly correlation is positive, we assume in-phase, otherwise out-of-phase. Although, technically, the threshold for in-phase is 0.3, for out-of-phase -0.3, and in-between no-phase, we use 0.0 as the threshold for simplicity and, more importantly, matching the classification of Apurv et al. (2017). For the precipitation seasonality index, the threshold is 0.6, based on the following table from Walsh and Lawler (1981). For the aridity index, we want to use a classification table provided by UNEP (1997) which has a threshold of 0.65 for arid/humid classification.
Upon obtaining the metrics for the selected stations, we classify the corresponding catchments of the selected stations according to Fig. 1. We refer to these catchments as gauged catchment since we used the existing data to classify them. For the remaining ungauged catchments, we utilize StreamCat attributes, which we retrieve using PyNHD, to train a deep learning algorithm using PyTorch Tabular Python package.
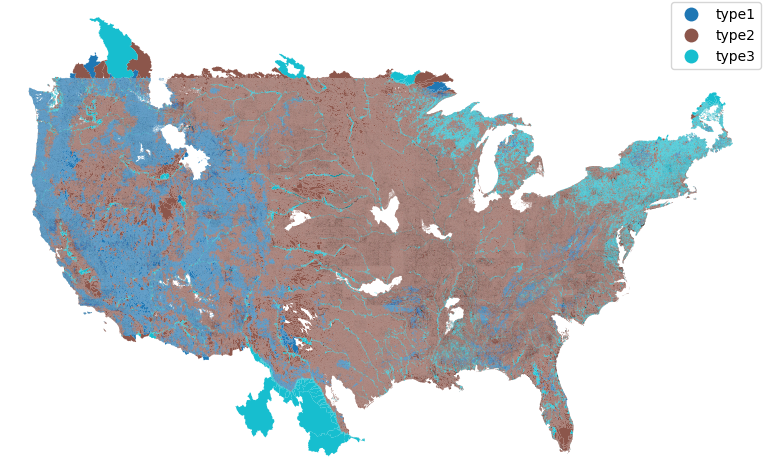
Fig. 2 depicts the result of the classification. It is apparent from the figure that along the west coast, type 1 is dominant, whereas in the middle and east coast type 2 and type 3 are dominant, respectively.
Figure 2. Classification of the NHDPlus catchments over CONUS based drought propagation mechanisms
Additional Resources
You can use this Jupyter Notebook to reproduce the results of this analysis.
About the author
Taher Chegini is postdoc at Purdue University. His main research focus is on large-scale urban hydrological modeling and hydroinformatics. https://cheginit.github.io/
References
Eltahir, E. A. B., and Yeh, P. J.-F. (1999), On the asymmetric response of aquifer water level to floods and droughts in Illinois, Water Resour. Res., 35( 4), 1199– 1217, https://doi.org/10.1029/1998WR...
Van Loon, A. F., & Van Lanen, H. A. J. (2012). A process-based typology of hydrological drought. Hydrology and Earth System Sciences, 16(7), 1915–1946. https://doi.org/10.5194/hess-16-1915-2012
Apurv, T., Sivapalan, M., & Cai, X. (2017). Understanding the role of climate characteristics in drought propagation. Water Resources Research, 53, 9304– 9329. https://doi.org/10.1002/2017WR021445
Newman, A. J., Mizukami, N., Clark, M. P., Wood, A. W., Nijssen, B., & Nearing, G. (2017). Benchmarking of a Physically Based Hydrologic Model. Journal of Hydrometeorology, 18(8), 2215–2225. https://doi.org/10.1175/jhm-d-16-0284.1
Hill, R. A., Weber, M. H., Leibowitz, S. G., Olsen, A. R., & Thornbrugh, D. J. (2015). The Stream-Catchment (StreamCat) Dataset: A Database of Watershed Metrics for the Conterminous United States. JAWRA Journal of the American Water Resources Association, 52(1), 120–128. Portico. https://doi.org/10.1111/1752-1688.12372
Chegini, T., Li, H.-Y., & Leung, L. (2021). HyRiver: Hydroclimate Data Retriever. Journal of Open Source Software, 6(66), 3175. https://doi.org/10.21105/joss.03175
Webster, P. (1976). Climate and life. M. I. Budyko (David H. Miller, Translator). Academic Press, New York, Quaternary Research, 6(3), 461-463. https://doi.org/10.1016/0033-5894(67)90014-2
Walsh, R. P. D., & Lawler, D. M. (1981). RAINFALL SEASONALITY: DESCRIPTION, SPATIAL PATTERNS AND CHANGE THROUGH TIME. Weather, 36(7), 201–208. https://doi.org/10.1002/j.1477-8696.1981.tb05400.x
UNEP (United Nations Environment Programme) (1997). World Atlas of Desertification: Second Edition. https://wedocs.unep.org/20.500.11822/30300