Hydroinformatics Blog - A Set of Open-Source Python Tools for Working with River Basin Data Collections
Posted Jan 9, 2024
Hydroinformatics Blog Post
Organized by the CUAHSI Informatics Standing Committee. Contributions are welcome, please contact Veronica Sosa Gonzalez at email hidden; JavaScript is required.
By: Scott D. Peckham
There are many different river basin data collections that have been used for hydrologic monitoring or modeling studies. Many have been created by federal agencies like the USGS, NOAA, EPA, and USDA. Some have been created in connection with NSF-funded projects like the CZOs (Critical Zone Observatories), LTER (Long-Term Ecological Research) and NEON (National Ecological Observatory Network). Yet others, usually subsets of the federal agency collections, have been created to support other modeling objectives (e.g., MOPEX and CAMELS). Sometimes a federal agency creates a new collection to supersede an existing collection. Several of these collections are briefly summarized in the next section. As might be expected, each of these data collections provide a different set of basin attributes, usually in the form of CSV or TSV files (comma or tab separated values), and sometimes also with ESRI shapefiles for all the basins in the collection. Unfortunately, there is a huge amount of heterogeneity across these basin collections, such as different attributes, different column headings/abbreviations for the same attributes, different measurement units, different methods of organizing files by region, and missing data. While some data sets are available on nice websites or through APIs, it can be surprisingly difficult to obtain some of these collections, especially the older ones, which may no longer be available at their original URL (e.g., MOPEX). It is also unclear to most potential users how these various basin collections relate to one another, or the extent to which they contain the same basins, and the sea of acronyms is daunting. A given basin, associated with a given stream gauge at its outlet, typically has many different IDs, such as a USGS 8-to-15-digit ID, a 5-character NOAA NWS location ID, a GOES satellite ID, and so on.
In order to address some of these issues, many of these data sets were acquired and then a set of Python utilities were developed, one set for each data collection, to help with collating, cleaning, augmenting, and extracting information from them. This work was performed in connection with the Next Generation Water Resources Modeling Framework (NextGen) that is currently under development by NOAA's Office of Water Prediction, in coordination with the USGS and other partners. NextGen provides increased flexibility for dealing with the hydrologic heterogeneity that exists across CONUS by allowing different hydrologic models to be used for different basins. However, this flexibility raises the question of which of the various hydrologic models in NextGen is best suited to modeling a particular river basin. This, in turn, naturally leads to the concept of hydrologic similarity, and an examination of different river basin classification systems such as HLR (Hydrologic Landscape Regions) and the SWB (Seasonal Water Balance) method of Berghuijs et al. (2014). Therefore, the set of Python utilities also includes tools to help with river basin classification.
River Basin Data Collections
- CAMELS (Catchment Attributes and Meteorology for Large-sample Studies). 671 CONUS basins with minimal human impact that span a wide range of hydroclimatic conditions. 52 basins also in MOPEX.
- MOPEX (Model Parameter Estimation Experiment). 431 well-monitored, lower-impact basins with focus on parameter estimation for hydrologic models.
- NOAA RFC (River Forecast Center) Basins. US is divided into 13 RFCs that collaborate with USGS to monitor 9109 basin DCPs (Data Collection Platforms) via the geostationary GOES satellite.
- USDA ARS (Agricultural Research Service) Experimental Watershed Network. 771 basins, many with long discharge records. In STEWARDS.
- USGS FPS (Federal Priority Streamgages). 4756 monitoring stations; "backbone" of the larger USGS stream gaging network.
- USGS HDCN (Hydro-Climatic Data Network). Data for 1639 USGS basins for the study of climate fluctuations.
- USGS GAGES-II (Geospatial Attributes of Gages for Evaluating Streamflow v2). 2057 "reference" (least-disturbed) sites and 7265 "non-reference" basins (9322 total). Most have discharge data for 20+ years. Has all but 7 MOPEX basins. A subset of 1947 "selected basins" has many additional attributes & includes all CAMELS basins and 743 HCDN basins. See Over et al. (2018).
- USGS NWIS Basins w/ Discharge Data. 27890 stations, about 9665 are active.
Also: CZO, LTER, & NEON basin collections.
Basin Classification Systems
Several basin classification systems can be used to divide basins into hydrologically similar groups. Tools for applying the HLR and SWB classification methods described here are included in the set of Python utilities.
Hydrologic Landscape Regions (HLR):
Winter (2001) & Wolock et al. (2004) divided the US into 43,931 watersheds and used cluster analysis to group them into 20 classes (with codes 1 to 20) based on similarities in land-surface form, geology (soil & bedrock types), and climate characteristics.
Seasonal Water Balance Method (SWB):
Berghuijs et al. (2014), using MOPEX data, introduced a more process-based system to classify basins based on 3 hydroclimatic indices for: (1) aridity (ratio of annual potential ET to precipitation), (2) seasonality & timing of precipitation, and (3) fraction of precipitation falling as snow. (We extended the SWB system to classify previously unclassified basins.)
Hydrograph-based Classifications:
Basins can also be classified based on the shapes of their observed or modeled hydrographs into groups such as: flashy, slow, snow-dominated, and regulated. Berghuijs et al. (2014) noted that basins in the same SWB class also have hydrographs with similar shapes.
Data-Driven Clustering Methods:
As part of the Summer Institute program run by NOAA's OWP and CUAHSI, Bolotin et al. (2022) used data-driven clustering methods based on machine learning (Random Forest) to show how basins could be matched to the most performant of 2 hydrologic models in NextGen.
A set of Python utilities (over 11,000 lines of code) were written to extract, clean, and collate information from numerous basin data collections. These utilities use a few standard Python packages including numpy, matplotlib, and gdal but seek to minimize the number of dependencies. This is a work in progress, but these open-source utilities can be found at: https://github.com/peckhams/topoflow36/utils/ngen. Information on each collection, including relevant URLs and papers, images, many of the original data files, as well as augmented or cleaned files created with the utilities, will soon be made available as part of a River Basin Repository at: https://github.com/peckhams/nextgen_basin_repo. Contributions to this open-source effort are welcome. The author has recently become aware of some projects with overlapping objectives and will seek to join forces with these other groups.
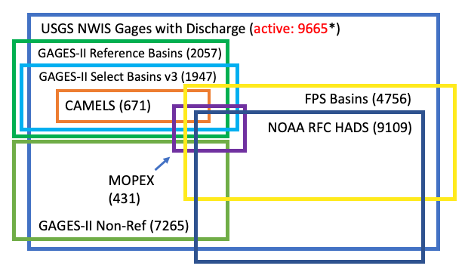
Figure 1. A Venn diagram showing many of the basin data collections.
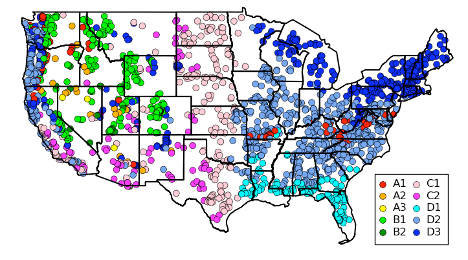
Figure2. Each dot represents a GAGES-II basin (centroid), classified into one of the 10 SWB classes. Within the A, B, & C classes, a higher number indicates higher aridity. The SWB classes are: A1, A2, A3: Precipitation out of phase w/ ET; B1, B2: Snow-dominated; C1, C2: Precipitation in phase with ET; D1, D2, D3: Mild seasonality and humid (D1 has no snow; snowiness of D3 > D2).
Acknowledgments:
Numerous conversations and support from colleagues at NOAA's Office of Water Prediction and Lynker are gratefully acknowledged.
About the author: Dr. Scott D. Peckham is a research faculty member at the University of Colorado in Boulder. He is a hydrologic modeler with a strong background in math, physics, and computation. He has developed many open-source models such as the TopoFlow hydrologic model and the commercial terrain analysis application RiverTools. He is also the lead developer of the Basic Model Interface (BMI) and the Scientific Variables Ontology (SVO).
Author’s website: https://www.colorado.edu/instaar/scott-d-peckham
References:
Berghuijs, W.R., M. Sivapalan, R.A. Woods, and H.H.G. Savenije (2014) Patterns of similarity of seasonal water balances: A window into streamflow variability over a range of time scales, Water Resources Research, 50(7), 5638-5661. (SWB method.)
Bolotin, L., F. Haces-Barcia, M. Liao, and Q. Liu (2022) Automated decision support for model selection in the NextGen National Water Model, p. 7-15, In: CUAHSI Technical Report 18, in coordination with the NOAA OWP Summer Institute program.
Jehn, F.U., K. Bestian, L. Breuer, P. Kraft, and T. Houska (2020) Using hydrological and climatic catchment clusters to explore drivers of catchment behavior, Hydrol. Earth Syst. Sci., 24, 1081-1100, https://doi.org/10.5194/hess-24-1081-2020.
Over, T.M., Farmer, W.H., and Russell, A.M. (2018) Refinement of a regression-based method for prediction of flow-duration curves of daily streamflow in the conterminous United States: U.S. Geological Survey Scientific Investigations Report 2018–5072, 34 p. (Key paper on GAGES-II.)
Wolock, D.M., T.C. Winter, G. McMahon (2004) Delineation and evaluation of hydrologic-landscape regions in the United States using geographic information system tools and multivariate statistical analyses, Environmental Management, 34(1), S71-S88. (HLR method.)