
FloodSavvy: A Tool to Make NOAA’s National Water Model Accessible for All
Posted Nov 12, 2025
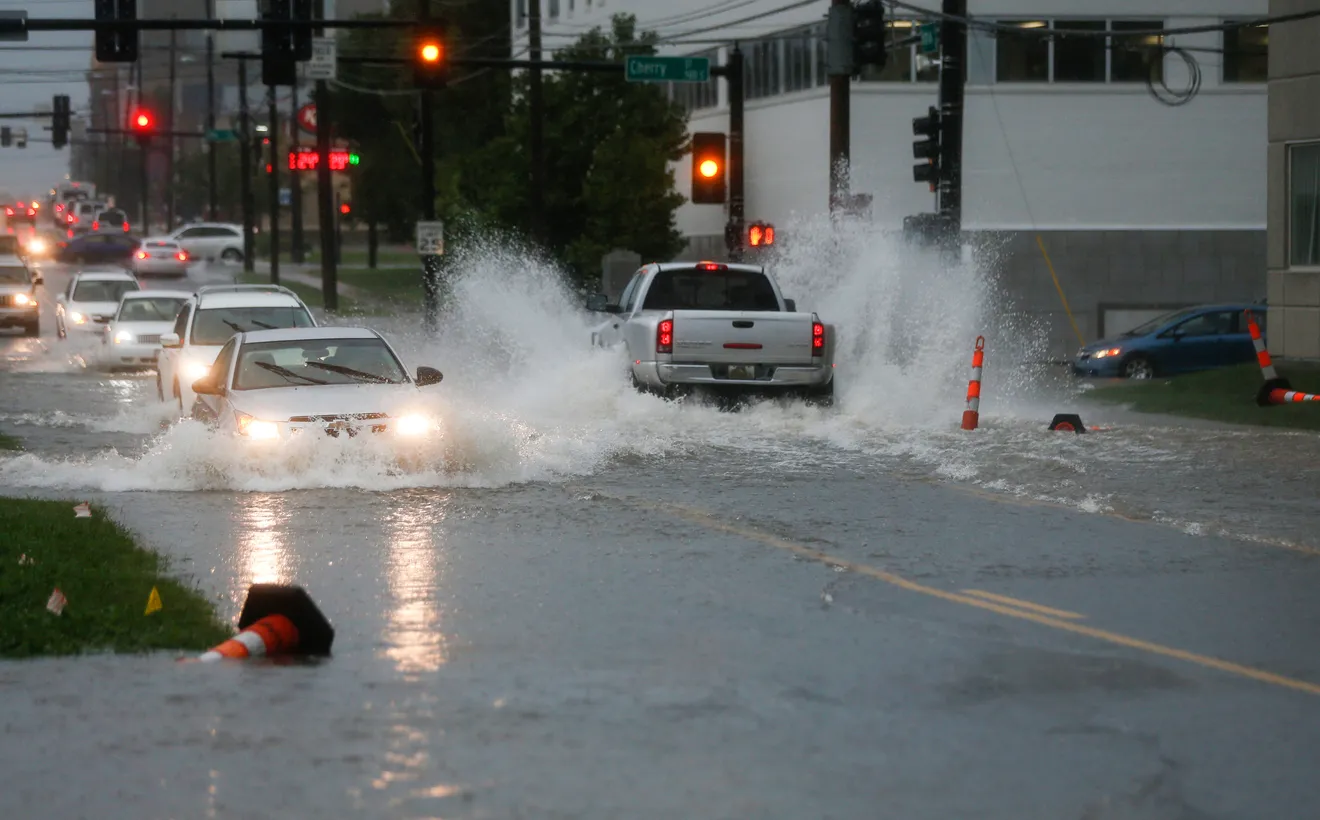
Flooding remains one of the most persistent natural hazards in the United States. Despite scientific progress in hydrological modeling and forecasting, many end-user communities still lack the tools or knowledge to translate complex data into decision-making in a timely manner. FloodSavvy, a new tool developed by the CUAHSI and the Global Resilience Institute (GRI) at Northeastern University, aims to change that in six communities across Vermont and Missouri by leveraging operational services and research products from NOAA (National Oceanic and Atmospheric Administration) and CIROH (Cooperative Institute for Research to Operations in Hydrology).

FloodSavvy’s Goal: From Complex Science to Community Action
FloodSavvy bridges the gap between advanced science and local action by transforming outputs from NOAA’s National Water Model (NWM) and its Flood Inundation Mapping (FIM) services, both part of the National Water Prediction Service (NWPS), into an intuitive, web-based interface designed for users with diverse professional backgrounds. Its purpose is to make flood forecast data usable and meaningful for community decision-makers, especially those without hydrological training.
Turning Data Into Decisions
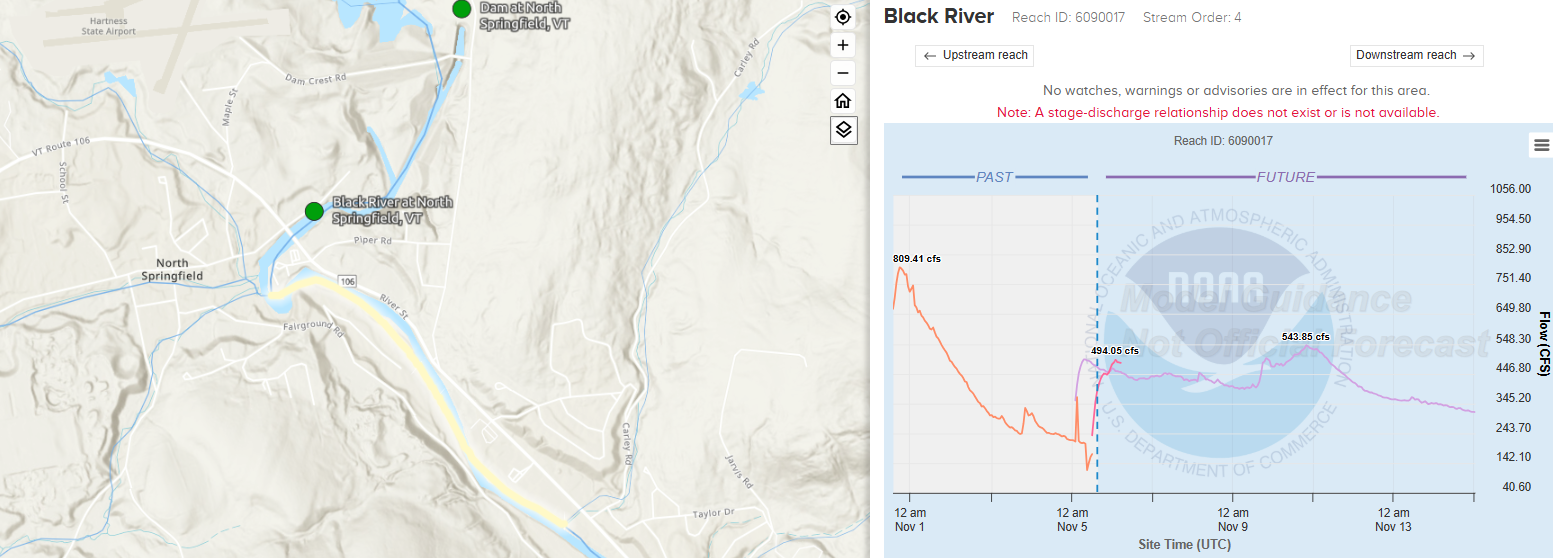
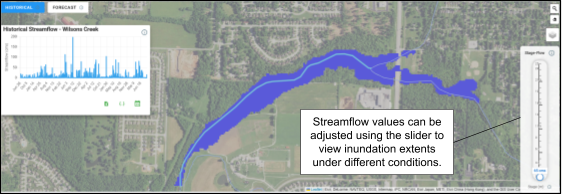
FloodSavvy emerged from a three-year research effort, supported by CIROH, examining how the NOAA’s National Water Model (NWM) and its Flood Inundation Mapping (FIM) services could support community resilience planning. Together, these tools provide short-, medium-, and long-term (30 days) streamflow forecasts for every river and stream reach (NWM) as well as flood extent visualizations (FIM) when a flood event is forecasted, currently for 60% of the U.S.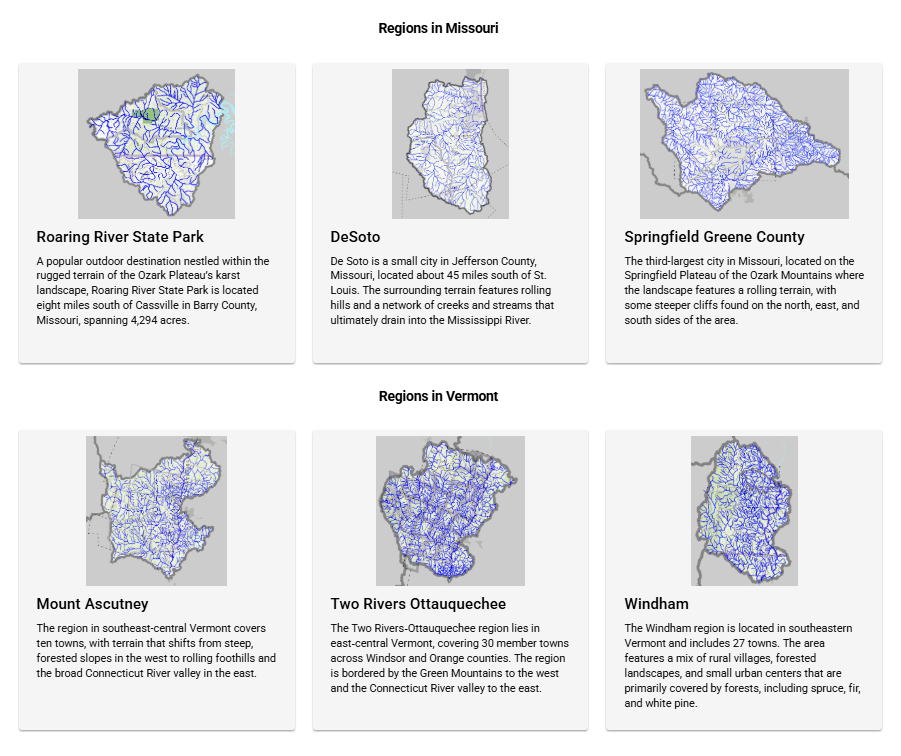
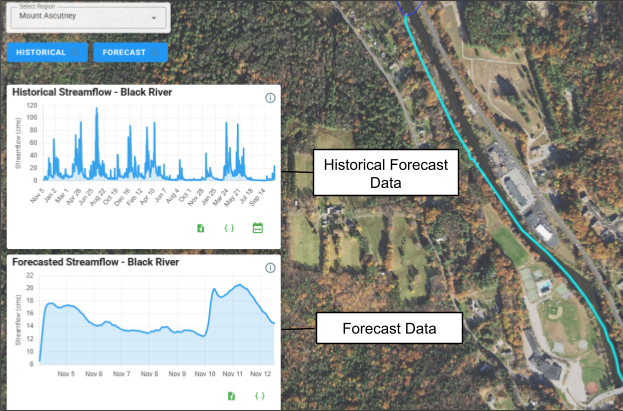
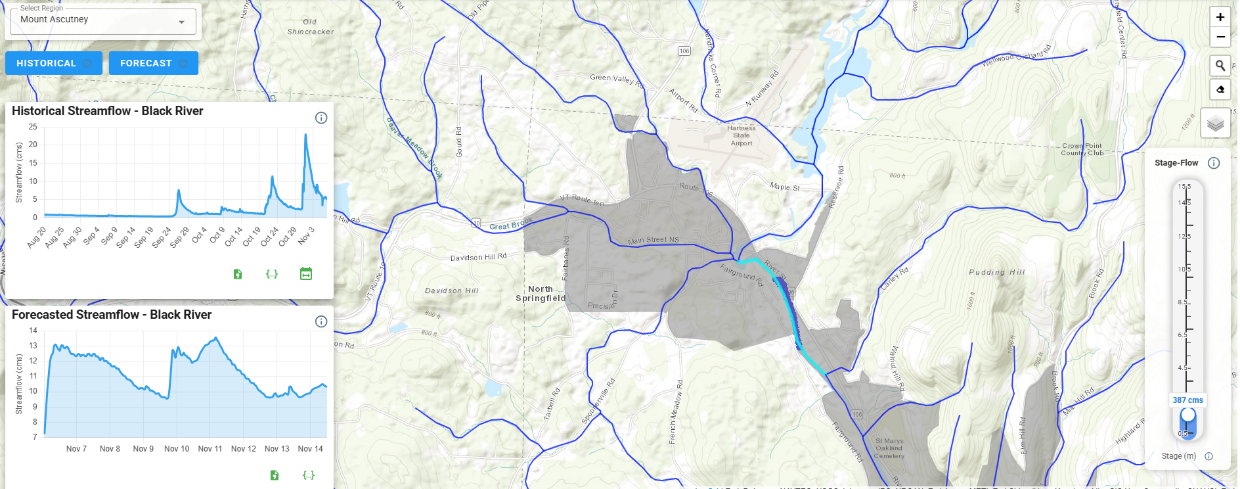
Explore Historical Streamflow Trends: FloodSavvy’s historical streamflow plots provide access to modeled data known as Analysis and Assimilation Products, which can help understand previous flooding events and monitor hydrologic change over time. These are not forecasts, but hourly model updates that use the best available observations to represent streamflow as accurately as possible (by default, covering the past 90 days, with records dating back to 2018). Communities can use this feature to revisit past events, see how rivers responded during storms or floods, and improve planning and education efforts. Together with forecasts, they offer both a view of past river behavior and guidance for what may happen next. Users can also define custom timeframes (e.g., the 2022 summer floods) to visualize specific trends or patterns.
Tutorials: This study revealed that most water decision-makers that we engaged with in the project lacked familiarity with the National Water Model. This NWM Tutorial serves as a 101 guide for new users, available in both PDF and video formats. Additionally, FloodSavvy includes scenarios that guide users in how to access vital pieces of flood forecast or historical streamflow data that is relevant to specific decision-making contexts, such as using FloodSavvy’s historical flood exposure and projected risks from future storms to design a flood resilience plan to prioritize vulnerable communities. By lowering the entry barrier to NOAA’s publicly available data, FloodSavvy allows users to bypass complex operations and directly explore information that’s relevant to their local context.
Built Together: A Co-Development Journey
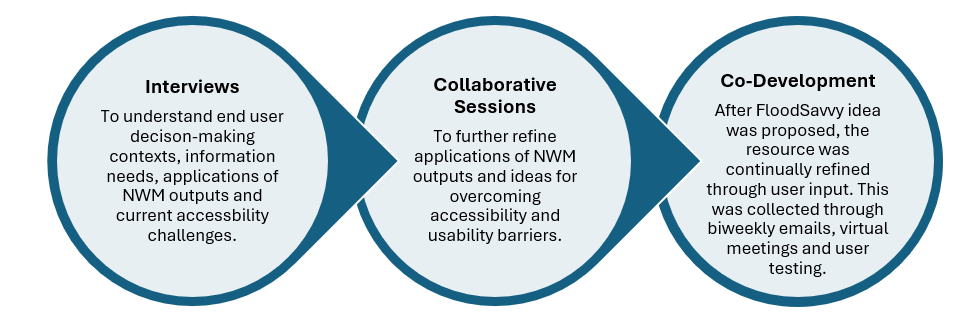
FloodSavvy is the result of a three-phase study that sought to explore how NOAA’s National Water Model could support community resilience planning and how NOAA and the NWC could facilitate this use. The first phase of the project focused on six communities across the US and interviewed professionals who support water- and resilience-related decision-making (Raub et al. 2024). We found that more than 60% of interviewed individuals involved in water-related decision-making and planning had never heard of the NWM. However, once introduced to it, many saw strong potential for how NWM’s flood forecasts and visuals could support their work. Since most of the stakeholders had no experience using the NWM, the second phase worked with a subset of those stakeholders to pilot desired applications of NWM outputs. During this phase, it became evident that first-time users faced barriers in accessing, interpreting, and utilizing NWM information effectively, especially when they lacked specialized hydrological expertise, capacity, time, and resources.
The third phase focused on further investigating these accessibility challenges and piloting ways to overcome them. Working with communities in Vermont and Missouri, we explored how NWM information could be made more accessible for use in their resilience- and water-related decision-making. Before creating FloodSavvy, we first needed to understand each community’s context, water vulnerabilities, and challenges and barriers for water decision-making and resilience planning. Through interviews, collaborative sessions, and prototype reviews, local partners identified key challenges, such as difficulty visualizing risk, especially in ungauged areas, and opportunities to connect the model’s outputs to real-world needs. They also highlighted the importance of simplicity to engage residents and decision-makers alike.
From here, our team developed FloodSavvy, tailoring this interface to each community’s specific data needs and aligning them with the capabilities of the NWM, all within a single platform. CUAHSI further refined the platform around three main use cases identified by the communities:
- Long-term planning: Using NWM data to identify flood-prone or water-vulnerable areas.
- Emergency preparedness: Leveraging real-time forecasts, particularly in ungauged regions.
- Public awareness: Incorporating NWM-based visuals into community education and outreach.
In practice, FloodSavvy is already helping communities put data into action. For example, in Missouri, emergency management staff used FloodSavvy to overlay local infrastructure maps with forecasted flood extents, helping them identify potential access challenges during heavy rainfall events. In Vermont, they are planning to use historical streamflow visualizations to integrate past flood trends into hazard mitigation planning, identify vulnerable areas – especially small, flood-prone streams with limited stream gauges, and communicate flood risks to the public.
While FloodSavvy builds on NOAA’s NWPS, it doesn’t replace it. Instead, the tool complements NWPS by translating NOAA’s sophisticated data into a more digestible, intuitive experience while preserving its scientific integrity. We also created a beginner-friendly NWM Tutorial: 101 Guide to Understanding and Using the NWM – available in both PDF and video format (coming soon!) – to help new users navigate the model. It provides a walk-through of how to (1) navigate the National Weather Prediction Service (NWPS) interface (water.noaa.gov), (2) access streamflow data on both gauged and ungauged rivers, and (3) activate the Flood Inundation Mapping layer.
Why It Matters
FloodSavvy’s co-development shows how user engagement can shape the design and function of scientific tools, transforming research into practical decision-support systems. For many communities, the challenge isn’t that flood data doesn’t exist but it’s that the available data and tools are often too technical to access or interpret. FloodSavvy addresses this by offering tailored map layers, easy to understand forecasts and historical streamflow data, and clear visualizations of inundation potential.
As extreme weather events grow more frequent, the demand for accessible climate and water data that help communities build resilience will only continue to increase. Projects like FloodSavvy underscore the importance of co-developing tools that are not only scientifically advanced but also shaped by user inputs to ensure they are truly usable by the communities they’re meant to serve. As FloodSavvy continues to evolve, its next steps include scaling its platform across new geographies, strengthening long-term adoption pathways, and refining how user feedback informs the evolution of hydrological products.
Want to Learn More?
Are you interested in expanding FloodSavvy’s coverage to your area? We'd be happy to chat! Please reach out to Kristin B. Raub, email hidden; JavaScript is required, Tony Castronova, email hidden; JavaScript is required and Irene Garousi-Nejad, email hidden; JavaScript is required.
Authors & Contributors
FloodSavvy is the work of many individuals, organizations, and community members who have contributed to its design and development. For details on CUAHSI and GRI team members and how to contact us, see https://floodsavvy.cuahsi.io/#/contact. This work would not have been possible without the valuable insights and support of the communities involved in this study.
Funding Acknowledgement
This research was supported by the Cooperative Institute for Research to Operations in Hydrology (CIROH) with funding under award NA22NWS4320003 from the NOAA Cooperative Institute Program. The statements, findings, conclusions, and recommendations are those of the author(s) and do not necessarily reflect the opinions of NOAA.